See your Sales Opportunities at a glance and celebrate your wins.

By actively tracking and analyzing sales opportunities, businesses can gain a comprehensive understanding of their performance, identify areas of improvement and make data-driven decisions. We help you to visualize your sales data and shed light on why it is paramount for sales success.
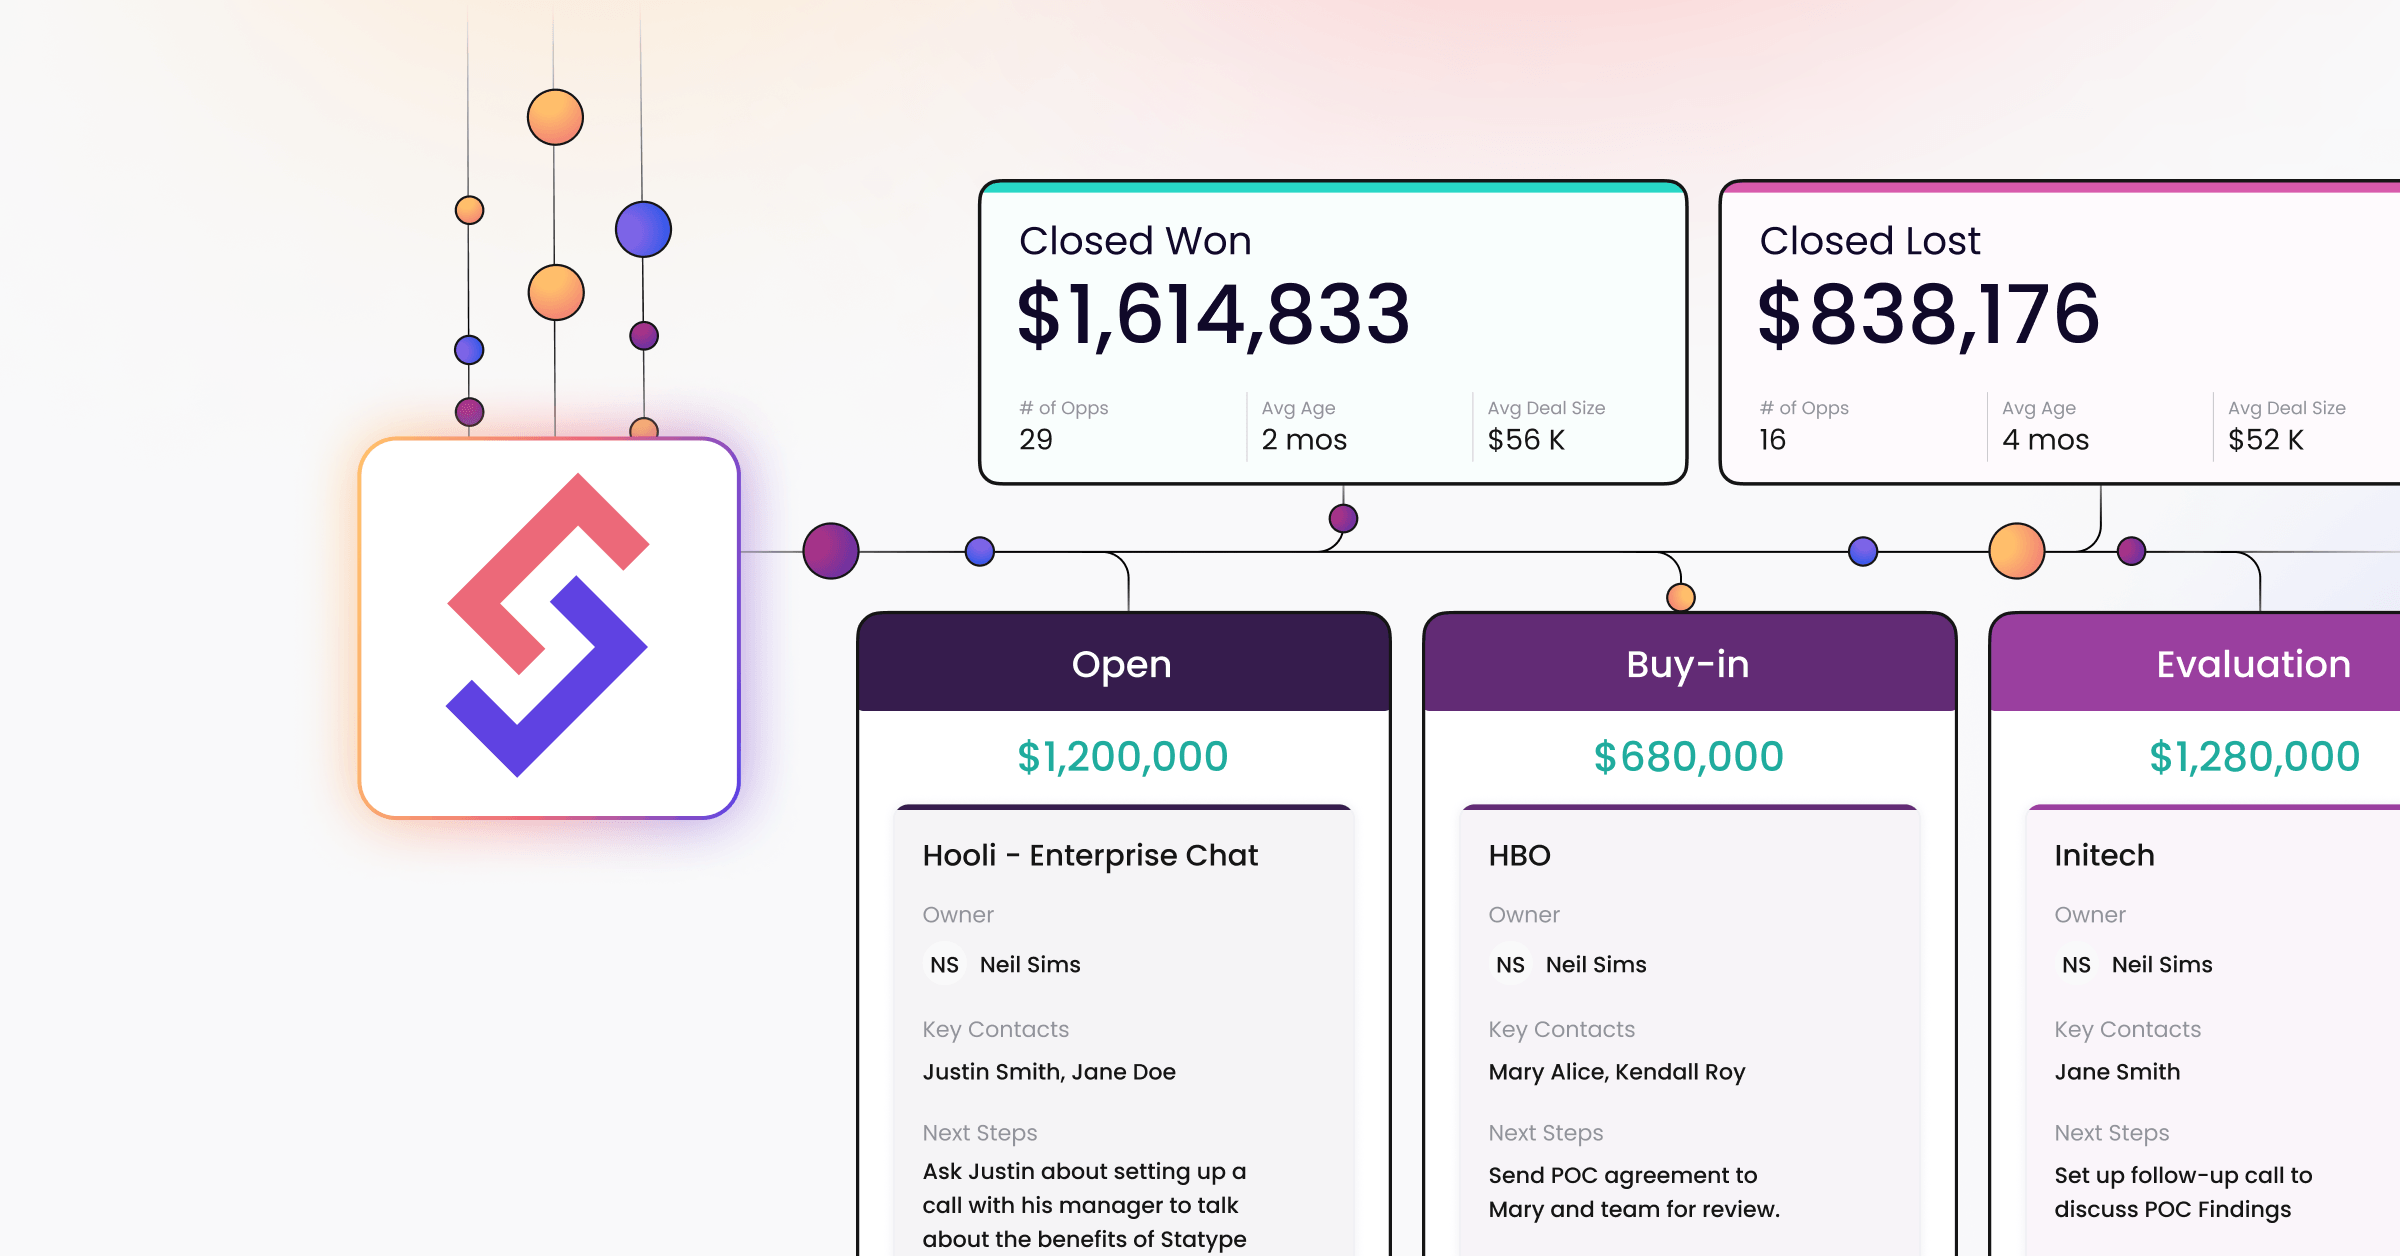
The Sales Overview gives you a high level breakdown of your Closed Won and Closed Lost summary. When evaluating sales performance, it’s important to examine not only the number of opportunities won but also the value of bookings secured. Your sales team closing one $1M deal in February versus your sales team closing ten $100K deals in February tell two different stories.

Two key metrics that are significantly important are the Average Sales Cycle (age) and Average Deal Size.
Understanding your Average Sales Cycles empowers you to optimize your sales process and improve forecasting accuracy. By tracking how long it takes to convert a lead into a paying customer, you can plan and allocate your sales team’s time, budget and efforts accordingly. This also provides valuable insights for forecasting and business planning. By analyzing historical data you can estimate the time it takes to close dates and predict revenue more accurately.
Knowing your Average Deal Size allows you to assess the value of each sale and align it with your revenue goals. Understanding your average deal size helps you allocate your resources effectively. It enables you to determine the appropriate level of investment in sales and marketing activities to acquire and retain customers in addition to helping you segment and prioritize your target customers.
Monitoring Closed Won and Closed Lost opportunities by month allows you to evaluate your sales team’s performance over time. This gives you the ability to identify trends and patterns that may indicate areas of strength or areas that need improvement as well as helping you forecast revenue accurately.
The ratio of Closed Won to Closed Lost opportunities provides valuable insights into your sales pipeline’s health and effectiveness of your sales process. By calculating the conversion rate on a monthly basis, you can identify fluctuations and patterns.
Tracking Closed Won and Closed Lost opportunities by month provides real-time feedback on the effectiveness of your sales strategies and tactics. If you observe a decline in Closed Won opportunities over a period of time it may indicate a need to reassess your approach, modify your value proposition, or refine your targeting.
Monitoring Closed Won and Closed Lost opportunity trends empowers you to evaluate performance, forecast revenue, analyze conversion rates, identify opportunities for improvement and adjust strategies accordingly. While an overview can give you an idea of trends and patterns it’s important you explore in-depth your closed won and lost analysis. This will allow you to align and collaborate with your marketing and sales teams to push towards strategies that continue to build and grow your business and solidify product-market fit.

Differentiating Closed Won opportunities by New vs Expansion or Upsell provides valuable insights into the effectiveness of your sales and marketing efforts. This metric helps you gauge the success of acquiring new customers versus nurturing existing ones, guiding your resource allocation and growth strategies accordingly.
A well-crafted sales pipeline is the lifeblood of revenue generation, providing a structured roadmap to track and nurture prospects, ensuring timely opportunities for conversion and growth.
A sales pipeline is a strategic framework that guides businesses through the journey of turning prospects into valued customers. It comprises various stages that reflect the progression of a potential sale, allowing sales teams to visualize and manage the entire process.
Pipeline creation refers to the initial stage of developing a sales pipeline. Open Pipeline refers to the stage in the sales process where leads or prospects are actively being pursued and managed by the sales team. It represents the subset of potential opportunities from the overall pipeline that have progressed beyond the initial stage.

Understanding where your prospects and customers are in your sales process alongside the number of open opportunities and amount helps paint a picture of the required path forward to close those opportunities. Layering this with your average sales cycles and deal size and applying conversion rates will allow you to assess how much revenue you may be able to close.

Analyzing the Average Deal Size at different stages of the sales pipeline helps in forecasting future revenue. By understanding the average value of deals at each stage, sales managers can estimate the potential revenue that can be generated from the open pipeline. This information assists in setting realistic sales targets and aligning resource allocation accordingly.
Examining the Average Deal Size by stage helps identify potential bottlenecks or areas of concern in the sales process. If there is a significant drop in deal size as leads progress through the pipeline, it may indicate issues such as ineffective qualification, pricing challenges, or value proposition misalignment. Recognizing these bottlenecks enables sales teams to address them and implement strategies to improve conversion rates and deal values.

Analyzing the average days in each stage of the sales pipeline provides valuable insights into the length of the sales cycle. By tracking the time it takes for leads to progress from one stage to another, sales managers can identify potential bottlenecks or areas where the sales process might be stalling. This information helps in optimizing the sales cycle and improving overall efficiency.
The average days in stage also contribute to measuring the sales velocity. Sales velocity refers to the speed at which leads move through the sales pipeline and ultimately convert into customers. By calculating the average time spent in each stage, sales teams can assess their sales velocity and identify opportunities for acceleration. Decreasing the average days in stage can lead to faster deal closures, increased revenue, and improved forecasting accuracy.
This simplified view displays your sales opportunities by stage and provides critical information such as opportunity name, owner, key contacts, opportunity amount, next step and next step date.

Sales Events display all the Sales related Statype business events. Ensuring events like past due opportunities don’t go unnoticed.

Reach out to us via email at contact@statype.com.